NOTE: This is version 1.3. A newer version 1.7 including forest loss through 2019 is availalbe.
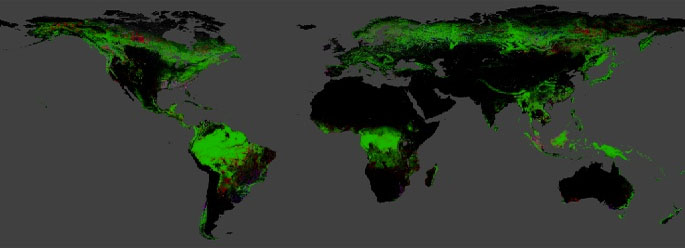
Results from time-series analysis of Landsat images in characterizing global forest extent and change from 2000 through 2015. For additional information about these results, please see the associated journal article (Hansen et al., Science 2013).
Web-based visualizations of these results are also available at our main site:
http://earthenginepartners.appspot.com/science-2013-global-forest
Please use that URL when linking to this dataset.
We anticipate releasing updated versions of this dataset. To keep up to date with the latest updates, and to help us better understand how these data are used, please register as a user. Thanks!
This update of gross forest cover loss includes a new 2015 loss layer. Relative to the version 1.0 product our method has been modified in numerous ways, and the new update should be seen as part of a transition to a future version 2.0 that is more consistent over the entire 2000-onward period. Key changes include:
These changes lead to a different and improved detection of global forest loss. However, the years preceding 2011 have not yet been reprocessed in this manner, and users will notice inconsistencies as a result. It must also be noted that a full validation of the results incorporating Landsat 8 has not been undertaken. Such an analysis may reveal a more sensitive ability to detect and map forest disturbance with Landsat 8 data. If this is the case then there will be a more fundamental limitation to the consistency of the mapped interannual loss before and after the inclusion of Landsat 8 data, and a validation of Landsat 8-incorporated loss detection is planned. The integrated use of version 1.0 2000–2012 data and updated version 1.3 2011–2015 data should be performed with caution.
Some examples of improved change detection in the 2011–2015 update include the following:
These are examples of dynamics that may be differentially mapped over the 2001-2015 period in Version 1.3. A version 2.0 reprocessing of the 2000-onward record is planned, but no delivery date is yet confirmed.
The original version 1.0 data is also still available for download here.
 This work is licensed under a Creative Commons Attribution 4.0 International License. You are free to copy and redistribute the material in any medium or format, and to transform and build upon the material for any purpose, even commercially. You must give appropriate credit, provide a link to the license, and indicate if changes were made.
Use the following credit when these data are displayed:
Source: Hansen/UMD/Google/USGS/NASA
Use the following credit when these data are cited:
Hansen, M. C., P. V. Potapov, R. Moore, M. Hancher, S. A. Turubanova, A. Tyukavina, D. Thau, S. V. Stehman, S. J. Goetz, T. R. Loveland, A. Kommareddy, A. Egorov, L. Chini, C. O. Justice, and J. R. G. Townshend. 2013. “High-Resolution Global Maps of 21st-Century Forest Cover Change.” Science 342 (15 November): 850–53. Data available on-line from: http://earthenginepartners.appspot.com/science-2013-global-forest.
This global dataset is divided into 10x10 degree tiles, consisting of seven files per tile. All files contain unsigned 8-bit values and have a spatial resolution of 1 arc-second per pixel, or approximately 30 meters per pixel at the equator.
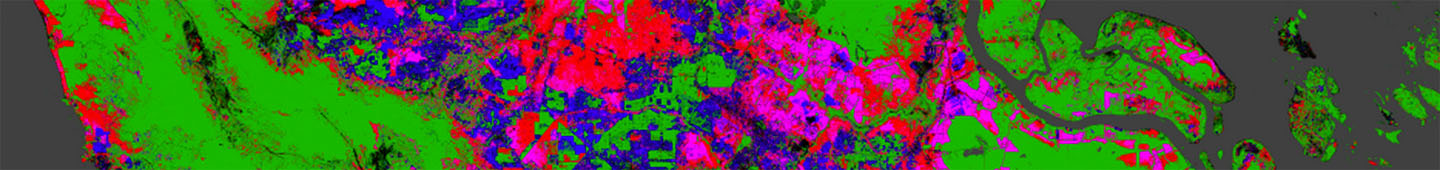
treecover2000)loss)gain)lossyear)datamask)first)last)Reference composite imagery are median observations from a set of quality assessed growing season observations in four spectral bands, specifically Landsat bands 3, 4, 5, and 7. Normalized top-of-atmosphere (TOA) reflectance values (ρ) have been scaled to an 8-bit data range using a scale factor (g):
The g factor was chosen independently for each band to preserve the band-specific dynamic range, as shown in the following table:
| Landsat Band | g |
|---|---|
| Band 3 (red) | 508 |
| Band 4 (NIR) | 254 |
| Band 5 (SWIR) | 363 |
| Band 7 (SWIR) | 423 |
To download individual 10x10 degree granules, click on a region on the map below and then click on the URLs underneath it.
We have provided a complete set of granules spanning the range 180W–180E and 80N–60S, but the granules over the ocean are provided for completeness only and do not contain any meaningful data. Should you wish to download a complete layer, you may download a text file containing the complete list of URLs for each layer:
treecover2000,
loss,
gain,
lossyear,
datamask,
first, or
last.
Note that the loss, gain, lossyear, and datamask layers compress extremely well (totalling less than 10GB each globally), and the treecover2000 layer compresses fairly well (less than 50GB), but the first and last multispectral layers are much larger (totalling over 600GB each). You may wish to take this into account when selecting which layers to download in their entirety.
You can also analyze these results directly in Google Earth Engine using the asset ID UMD/hansen/global_forest_change_2015_v1_3. If you are not yet an Earth Engine user, you may sign up here. To help you get started we have made an introductory tutorial showing examples of how to use this data to do a variety of things, including generating indices from annual Landsat composites and computing tree loss per year for regions of interest.